How to Make GTM Reports Actually Useful
Read time: 7 minutesWritten by:
-

Eddie Reynolds
Founder & CEO
Resources in This Article:
Guide: Build Your Own AI-Powered GTM Dashboard
I was reviewing a client’s pipeline report a while back and looked at close rates across the team. One rep was closing 5% of their deals. Another was closing 85%.
Neither number is real. You can’t be bad enough at sales to lose 95% of qualified deals, and you can’t be good enough to win 85% of them. So I looked at what each rep was doing.
The first threw every meeting they took into the CRM and called it pipeline. On paper it looked great: a $1M quota, $3M in pipeline, 3x coverage. At a 5% close rate, though, that $3M isn’t even a quarter the pipeline they need.
The second rep did the opposite, waiting until a deal was practically signed before entering it, so nothing ever slipped.
Same report, two reps, and the company had no real idea how much pipeline it had or where it would land at the end of the quarter. Other reps on the team were everywhere across the spectrum between those two.
That report did its job. It showed exactly what the team fed it, and the team was feeding it fiction. A pipeline report can’t tell you whether a deal belongs there when nobody has agreed on what a qualified deal even looks like. Get the process underneath right and the same report starts telling the truth. Here’s how.
Revenue Leaders
Need help executing your highest-priority GTM Ops initiative within the next quarter? Apply for The First 90 Program.
5 Steps to a Better Reporting Process
Most people’s first instinct with a reporting problem is to log into the CRM and build the report. Add the fields, set the filters, feed it whatever data is handy. That’s the easy part, and on its own it changes nothing. Here’s the order that actually works.
1. Write down the definitions. What is an MQL? What is a sales-qualified opportunity? What are the entry and exit criteria for each stage? Put it on paper, circulate it, and get real agreement. When marketing and sales are working off different definitions of a lead, every meeting turns into an argument about whose number is right instead of a conversation about the business.
2. Build the reporting structure. Decide what you want to see, not just how many opportunities sit in each stage. Who the decision maker is. What their decision criteria are. The report should carry the information that tells you whether a deal is real, not only where it sits.
3. Automate what you can. Website lead capture, email, calendar, call transcription. Tools like Attention and Momentum can read call transcripts and populate Salesforce fields for you. Every manual step you remove is a human error you won’t have to chase down later.
4. Do the last mile by hand. Moving a deal into your first qualified stage is a human decision, and it should stay one. AI can flag that a rep hasn’t reached the decision maker. A person still has to decide the deal is genuinely qualified, and you have to train reps on where that line sits.
5. Inspect and coach on a cadence. This is the most important step by a mile! You won’t have a clean pipeline unless you inspect it and coach reps on what belongs in it, week after week. Same goes for follow-ups. If nobody checks that reps follow up before marking a lead dead, you’ll pull the report in six months, see a terrible conversion rate, and blame marketing for a sales problem.
When sales genuinely follows up enough times and still converts at 1%, that’s a real signal to change the definition of a qualified lead, not to blame the sales team.
We helped a client do just this. They generated hundreds of thousands in qualified pipeline in a few weeks! If a cold prospect converts and your inbound leads don’t, the lead definition is what’s broken.
Make Coaching Precise
Once the data underneath is real, coaching stops being a guessing game. I like the way Kevin Dorsey frames this. Instead of asking a rep where they think they need to improve, you show them. Here’s your close rate, here’s where the top reps land, and here’s the lever that gets you to quota. Maybe you’re at a 15% Close Rate because you never learned to run discovery properly for this buyer, so let’s work on that. You can only have that conversation when the numbers under the report are trustworthy. Without them, the best you can offer is a generic pep talk.
Don’t Stop at the Dashboard
A high-level dashboard is fine for a surface read, but real improvement comes from segmentation. Give RevOps the time to dig deep into the data. Maybe you win twice as much from cold calls to tech companies as you do from manufacturing. Pull the data and check, and now you know where to point the team.
Picture the scene from the movie Moneyball, where Jonah Hill shows the player his on-base percentage doubles when he hits to right field vs left. That’s the kind of granularity in data insights that becomes valuable.
It’s also how you avoid expensive mistakes. This is so common it’s a cliche. One rep gets fired despite doing all the right things because their territory was mission impossible. Another rep is going to club despite mailing it in and ignoring half their top accounts because they’re fed a flood of high quality leads. I saw this exact thing, first hand, even at Salesforce, where they are supposed to know better.
None of these fixes doubles revenue on its own, but a percent here and a percent there, across the whole engine, adds up to millions with no new headcount.
Remember this takes three things: accurate data, someone with the time and skills to analyze it, and a management team that actually takes action on these insights. Put the CRO in a room with sales, marketing, success, product, and finance to decide what to do with what the analysis turns up. Skip that and the dashboard just sits there.
Where to Start
Don’t try to fix all of your reporting at once. Pick one thing. Is it new business or retention? Within new business, pipe generation or closing? Keep narrowing until you land on the one area that matters most right now, then build that report today and put it in front of yourself every week.
When a client wants a wall of dashboards, we don’t hand them another stack of Salesforce reports anymore. We build one AI-powered dashboard that pulls revenue, pipeline, leads, website, and audience numbers from every system in a single run, shows actual against target and the change from the prior period in every cell, and toggles from week to quarter to year without rebuilding anything.
Claude sits inside it and answers questions in plain English, straight from the figures on the page. I hope I never build another report in Salesforce again.
We wrote up the entire build, start to finish, in a step-by-step guide.
Build Your Own AI-Powered GTM Dashboard →
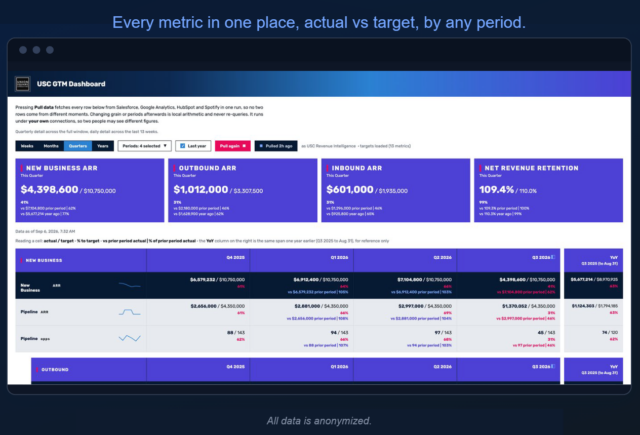
The dashboard is the easy part. Getting the data right is the hard part, and it’s where most of these projects die. Step one in the guide isn’t code, it’s defining what each metric means and which system owns it, with your leadership team in the room. Everything above still applies.
Get the process right and the page runs itself. Skip it and you’ve built a faster way to stare at numbers you can’t trust.
If you’d rather have us build and implement it with your team, check out The First 90 program. We’ll get your highest-priority GTM motion executing smoothly and predictably within 90 days, tailored for revenue impact.
Revenue Leaders
Need help executing your highest-priority GTM Ops initiative within the next quarter? Apply for The First 90 Program.